

 Contact Us

 Home /
 US Industrial Robot Installations 2025: What the Numbers Mean — and What They Don't
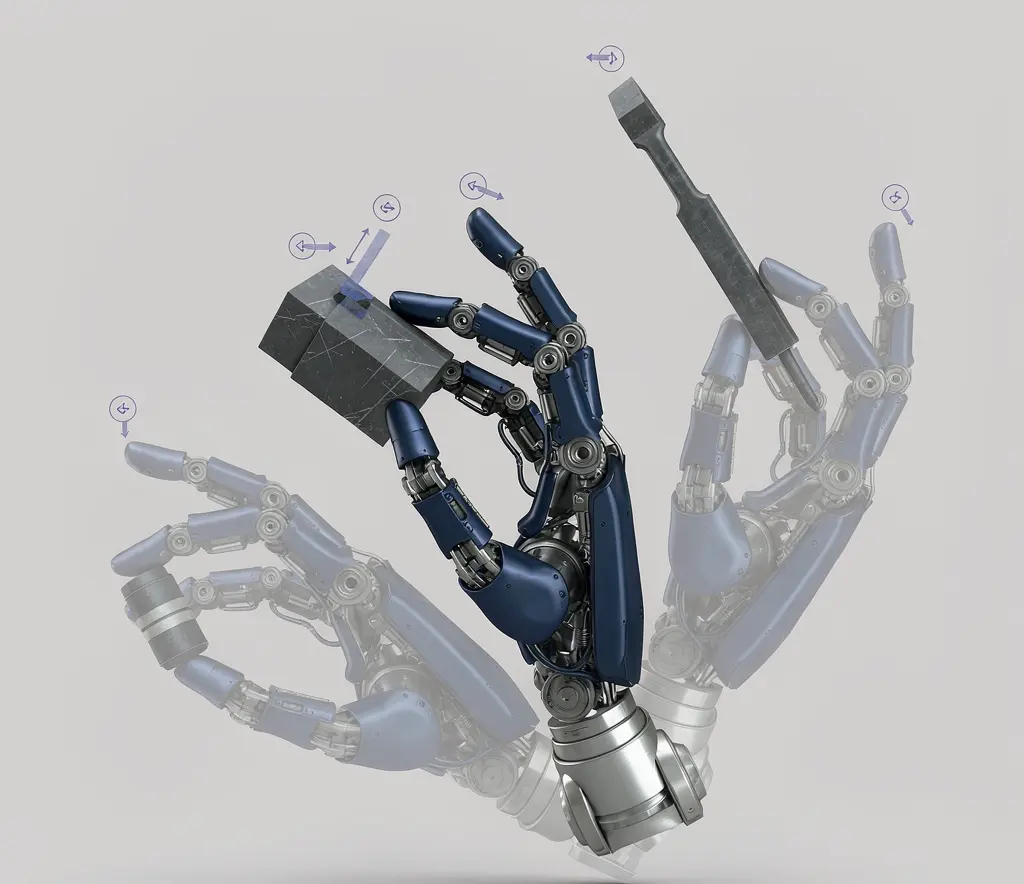
Humanoid Robot Hand Dexterity Verification: Grasp Set, Tool Use, Force Control, and Recovery
Oct 08, 2026

Industrial Exoskeleton Fit and Sizing: Anthropometry, Adjustment Time, PPE, and Shared-Device Programs
Oct 08, 2026

Robot Duty Cycle and Thermal Limits: Why Rated Payload and Speed Do Not Guarantee Continuous Operation
Oct 08, 2026

Robot IP Ratings Explained: What IP54, IP65, and IP67 Do — and Do Not — Prove
Oct 08, 2026
US industrial robot installations reached 38,000 units in 2025, an 11% year-on-year increase (IFR preliminary data, released June 18, 2026). The food and beverage sector showed the strongest growth rate among non-automotive sectors, at approximately +30% year-on-year. The automotive sector remained the largest single sector at approximately 13,500 installations. Food, metal and machinery, and electrical-electronics each accounted for approximately 3,000 installations (IFR preliminary 2025 data).
These numbers signal continued automation adoption growth in the US market. But they do not tell you whether robot prices are rising, whether integrators in your sector are available, or what your project ROI will be. Installation data is market context — not a procurement shortcut.
This article explains what the 2025 US installation numbers tell a buyer, what they do not tell, and how to avoid the most common misreading of IFR data. For humanoid robot deployment status in 2026, see Article 19.
What 38,000 Installations and +11% Actually Tell You
The headline — 38,000 installations, +11% YoY — tells you three things that matter for procurement:
- The US automation market is growing, not contracting. This matters for supplier availability: a growing market attracts more integrators, more service providers, and more trained operators. A shrinking market would signal the opposite — an ecosystem losing capacity.
- Non-automotive sectors are accelerating. The food sector’s +30% growth rate is the most significant signal for non-automotive buyers. Historically, the robot integrator ecosystem was built around automotive. Growth in food, metal fabrication, and electronics means the ecosystem is broadening — more integrators are gaining experience outside automotive, and more application templates are being developed for non-automotive use cases.
- Automotive remains the volume anchor. At approximately 13,500 installations, automotive still accounts for over a third of US robot installations. This means the mature automotive integrator ecosystem continues to exist — but it also means non-automotive buyers should not assume that the large overall installation number reflects maturity in their specific sector.
What These Numbers Do Not Tell You
- They do not tell you current pricing. Robot prices depend on component costs, exchange rates, and supplier competition — not on annual installation trends.
- They do not tell you lead times. Lead times depend on current production capacity and order backlog, not last year’s installation numbers.
- They do not tell you which supplier is right for your application. Installation data is market-wide; supplier selection requires application-specific evaluation.
- They do not tell you your project ROI. Your ROI depends on your labor costs, production volumes, and specific application — not on market-wide installation numbers.
- They do not distinguish net new automation from replacement. Some of the 38,000 installations may be replacing retired robots, not adding new automation capacity.
The Three Metrics Buyers Confuse
Annual Installations
Definition: The number of new industrial robots installed in a given year.
What it tells you: Market growth trend and demand signal. Rising installations indicate growing adoption — more companies are buying robots.
What it does not tell you: It does not tell you how many robots are currently in use (that is operational stock). It does not tell you whether new installations are replacing retired robots or adding to the total. A year with 500,000 installations might include 200,000 replacements for retired units — meaning net new automation is 300,000, not 500,000.
Operational Stock
Definition: The total number of industrial robots currently in use at a given time.
What it tells you: Market maturity and automation density. A high operational stock means many robots are already deployed — the market may be more mature, with experienced integrators, service providers, and trained operators available.
What it does not tell you: It does not tell you how recently the robots were installed. A country with 2 million robots in operational stock may have installed most of them 5–10 years ago — the installed base may be aging, with replacement demand building.
Robot Density
Definition: The number of robots per 10,000 employees in the manufacturing sector.
What it tells you: The level of automation relative to the workforce. A density of 300 means 3 robots for every 100 manufacturing workers. This metric allows comparison between countries and sectors with different workforce sizes.
What it does not tell you: It does not account for differences in manufacturing mix. A country with a high proportion of automotive manufacturing (which is heavily robotized) will have higher density than a country focused on food processing (which is less robotized) — even if both are equally automated within their respective industries.
Data-Definition Table
| Term | Definition | What It Tells Buyers | What It Does Not Tell Buyers | Typical Lag |
| Annual installations | New robots installed in a year | Growth trend, demand signal | Net new vs replacement; sector breakdown | 9–12 months |
| Operational stock | Total robots in use | Market maturity, service ecosystem | Age of installed base; replacement cycle | 9–12 months |
| Robot density | Robots per 10,000 manufacturing employees | Automation level comparison | Manufacturing mix differences | 9–12 months |
IFR World Robotics 2025 Report: Key Data (Covering 2024)
The IFR World Robotics 2025 report, published September 25, 2025, provides the most recent comprehensive global data:
Global Figures
- Global industrial robot installations in 2024: 542,000 units (4th consecutive year above 500,000)
- Global operational stock in 2024: 4,664,000 units (+9% year-over-year)
- Regional distribution of new deployments: Asia 74%, Europe 16%, Americas 9%
- IFR forecast for 2025: approximately 575,000 units (+6%) (IFR forecast, not measured)
- IFR forecast for 2028: over 700,000 units (~10% CAGR) (IFR forecast, not measured)
US-Specific Data
The Americas accounted for 9% of global deployments in 2024. According to IFR preliminary data released June 18, 2026, US industrial robot installations reached 38,000 units in 2025, an 11% year-on-year increase. This signals continued automation adoption growth in the US market despite the global data lag.
Data context: The IFR World Robotics 2025 report (published September 2025) covers 2024 data. The preliminary 2025 US figure was released by IFR on June 18, 2026. Full sector and regional breakdowns for 2025 may not be available until the complete World Robotics 2026 report is published. For procurement decisions requiring current sector-specific US data, contact IFR directly or consult the full report when available.
China Data (for Context)
- China installations in 2024: 295,000 units (+7%) (IFR World Robotics 2025 report), highest ever recorded for any country
- China operational stock: 2,027,000 units (IFR World Robotics 2025 report), more than 50% of global total
- Chinese domestic suppliers: 57% market share (up from 47% in 2023)
- Sector breakdown: Electrical/electronics 83,000 units; Automotive 57,200 units
Why the Data Lag Matters for Procurement
IFR data has a 9–12 month lag. The 2024 data was published in September 2025. If you are making a procurement decision in mid-2026, the most recent comprehensive data is 18 months old.
This lag matters because:
- Market conditions change. Robot prices, lead times, and component availability can shift significantly in 18 months. A market that was supply-constrained in 2024 may have excess capacity in 2026.
- New entrants and products. New robot models, new suppliers (including Chinese domestic suppliers whose market share grew from 47% to 57% in one year), and new technologies may not be reflected in the data.
- Sector-specific trends. The aggregate installation number (542,000) masks sector differences. If your industry is automotive, the trend may be different from food and beverage or electronics.
Procurement implication: Use IFR data for market context and long-term trend analysis. Do not use it for current pricing, lead time, or supplier availability decisions. For those, contact suppliers and integrators directly and request current quotations.
Sector Trends: Beyond Automotive
The automotive industry has historically been the largest robot user, but growth is shifting to other sectors. Understanding this shift helps buyers in non-automotive industries assess whether the market is developing the ecosystem they need (integrators, service providers, trained operators) for their sector.
Why This Matters for Non-Automotive Buyers
If you are in food processing, metal fabrication, or electronics manufacturing, the historical dominance of automotive means:
- Fewer integrators with experience in your sector — most integrators built their expertise in automotive
- Fewer proven application templates — your application may be a custom development rather than an off-the-shelf solution
- Different safety and regulatory requirements — food processing has hygiene standards (FDA, HACCP) that automotive does not
- Different ROI calculations — labor cost structures and production volumes differ from automotive
As installations grow in non-automotive sectors, the ecosystem matures — more integrators gain experience, more application templates are developed, and more trained operators are available. The IFR data showing growth beyond automotive signals that this ecosystem is developing.
Sector-to-Automation-Needs Matrix
| Sector | 2025 US Installations (IFR Preliminary) | Typical Robot Applications | Procurement Considerations |
| Automotive | ~13,500 | Welding, painting, assembly, material handling | Mature ecosystem; many integrators; proven applications |
| Food and beverage | ~3,000 (+30% YoY) | Pick-and-place, packaging, palletizing | Hygiene standards (FDA, HACCP); washdown-rated equipment; sanitary design; fastest-growing non-automotive sector |
| Metal and machinery | ~3,000 | Welding, cutting, material handling | Programming flexibility for high-mix; positioner integration |
| Electrical/electronics | ~3,000 | Assembly, testing, material handling | Precision requirements; cleanroom considerations; high-mix |
| Logistics/warehousing | Data not separately reported in preliminary release | Palletizing, depalletizing, sortation, transport | AMR/forklift integration; variable product handling; 24/7 operation |
| Pharmaceutical | Data not separately reported in preliminary release | Dispensing, inspection, material handling | GMP compliance; validation requirements; cleanroom; audit trail |
Sector installation figures are from IFR preliminary 2025 data (released June 18, 2026). Sectors not listed separately in the preliminary release are marked accordingly. Full sector breakdowns will be available in the complete World Robotics 2026 report.
How to Use Installation Data in a Procurement Business Case
Installation data is useful for:
- Market context: “The global robot market grew to 542,000 installations in 2024, indicating strong adoption trends across industries.”
- Sector benchmarking: “Robot installations in the electrical/electronics sector reached 83,000 units in China, suggesting a mature supplier ecosystem for electronics automation.”
- Trend justification: “Operational stock reached 4.6 million units globally, indicating that service providers, training programs, and replacement parts are widely available.”
Installation data is not useful for:
- Current pricing: Robot prices change with component costs, exchange rates, and supplier competition — not with annual installation trends
- Lead time estimation: Lead times depend on current production capacity and order backlog, not last year’s installation numbers
- Supplier selection: Installation data does not tell you which supplier is right for your application
- ROI calculation: Your ROI depends on your labor costs, production volumes, and specific application — not on market-wide installation numbers
Buyer Implication Checklist
Before using IFR installation data in a procurement decision, verify:
- Which metric are you reading? (Installations, operational stock, or robot density — they measure different things)
- What year does the data cover? (IFR 2025 report covers 2024 data — there is a 9–12 month lag)
- Is the data global, regional, or country-specific? (Global trends may not reflect your local market)
- Is the data sector-specific? (Aggregate numbers mask sector differences)
- Is the data primary (IFR report) or secondary (news article citing IFR)? (Always go to the primary source)
- Have you verified any specific numbers against the IFR report itself? (News articles may simplify or misquote)
- Are you using the data for market context (appropriate) or for current pricing/lead time (not appropriate)?
- If citing US-specific data: IFR preliminary 2025 data released June 18, 2026 reports US 38,000 installations, +11% YoY
- For US procurement: does the 11% installation growth signal affect your supplier lead times, integrator availability, or operator hiring market?
Illustrative Scenario: The Business Case Error
A procurement team at a food processing company used the IFR global installation figure (542,000 units in 2024) to justify a robot palletizing investment. The business case stated: “With 542,000 robots installed globally, the technology is proven and the supplier ecosystem is mature.”
The installation number was accurate, but the inference was wrong for their context. Of the 542,000 installations, the majority were in automotive and electronics — not food processing. The food processing robot ecosystem was less mature: fewer integrators had food industry experience, fewer washdown-rated robot models were available, and the application templates for food palletizing were less developed than for automotive material handling.
The installation data was not wrong — it was misapplied. The team should have looked for food-processing-specific installation data (available in the full IFR report’s sector breakdown) and contacted integrators with food industry experience to assess the ecosystem maturity for their specific application.
This is an illustrative scenario based on common procurement decision-making patterns. Actual sector breakdowns and ecosystem maturity vary by region and application.
Request a Quote or Technical Evaluation
Tell us what you need the robot to do. Even if some technical details are not yet confirmed, our team can help evaluate suitable options.
Please share, if available: application, key requirements, site and integration conditions, quantity, destination, and target timeline.
Send Your RequirementsRelated Articles
This article covers industrial robot installation data and market metrics. For humanoid robot deployment status in 2026, see Article 19.
Share on Social:


Contact Us
In This Article
Humanoid Robot Hand Dexterity Verification: Grasp Set, Tool Use, Force Control, and Recovery
Oct 08, 2026
Industrial Exoskeleton Fit and Sizing: Anthropometry, Adjustment Time, PPE, and Shared-Device Programs
Oct 08, 2026
Robot Duty Cycle and Thermal Limits: Why Rated Payload and Speed Do Not Guarantee Continuous Operation
Oct 08, 2026
Robot IP Ratings Explained: What IP54, IP65, and IP67 Do — and Do Not — Prove
Oct 08, 2026