

 Contact Us

 Home /
 How Many Robots Do You Actually Need? Fleet Sizing for Cleaning, Delivery, and Intralogistics Projects
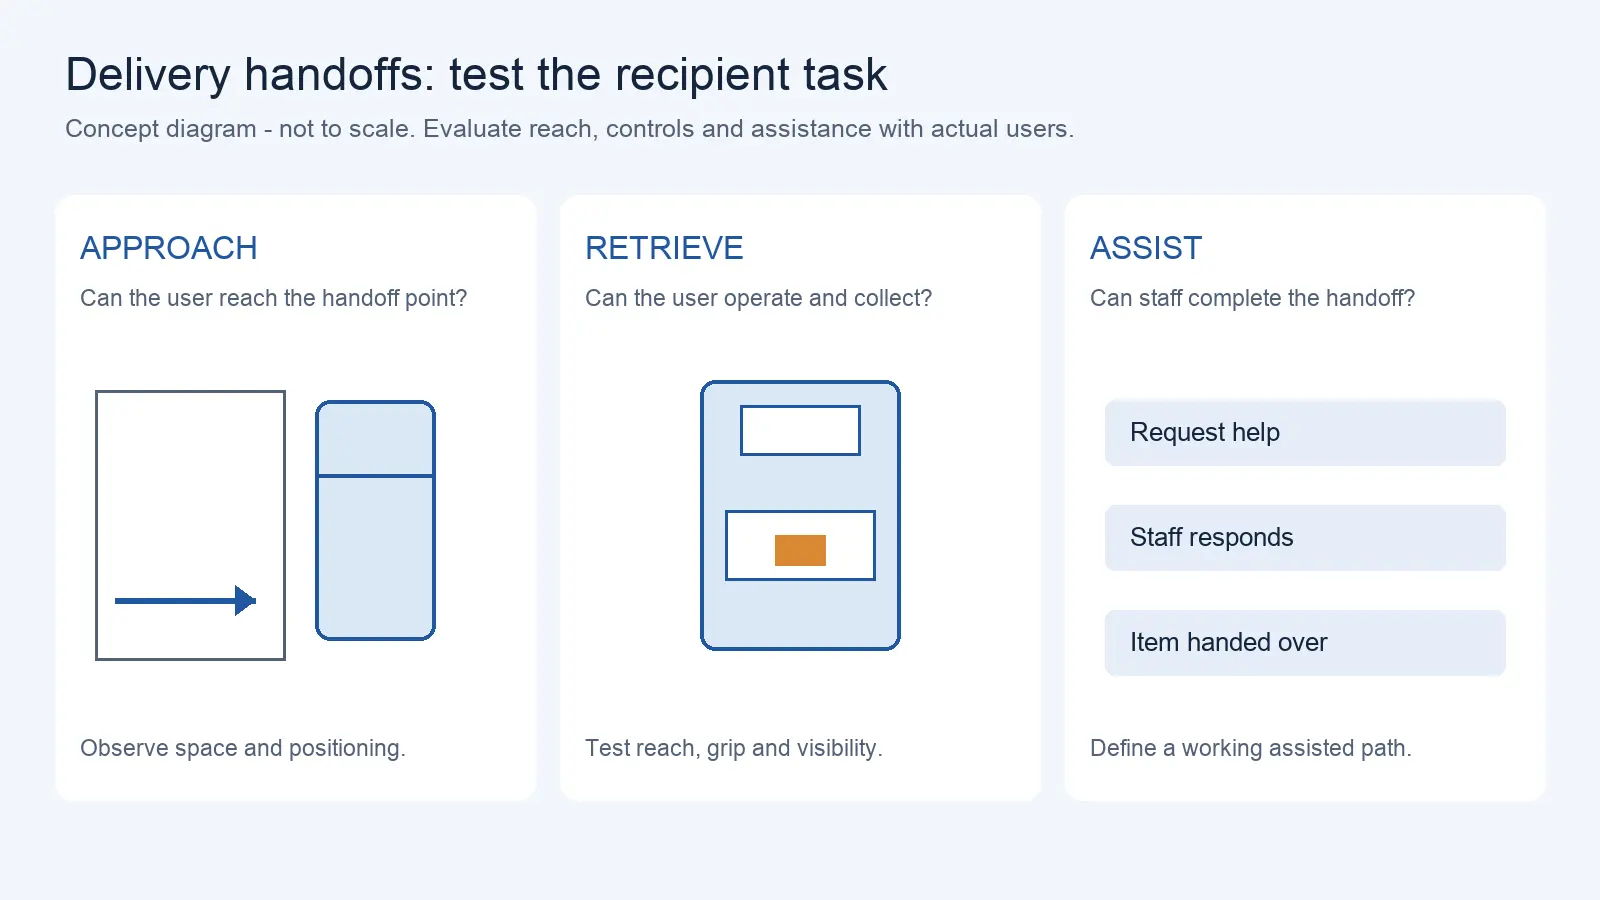
Delivery Robot Accessibility: Tray Reach, Controls, and Assisted Handoffs
Oct 12, 2026
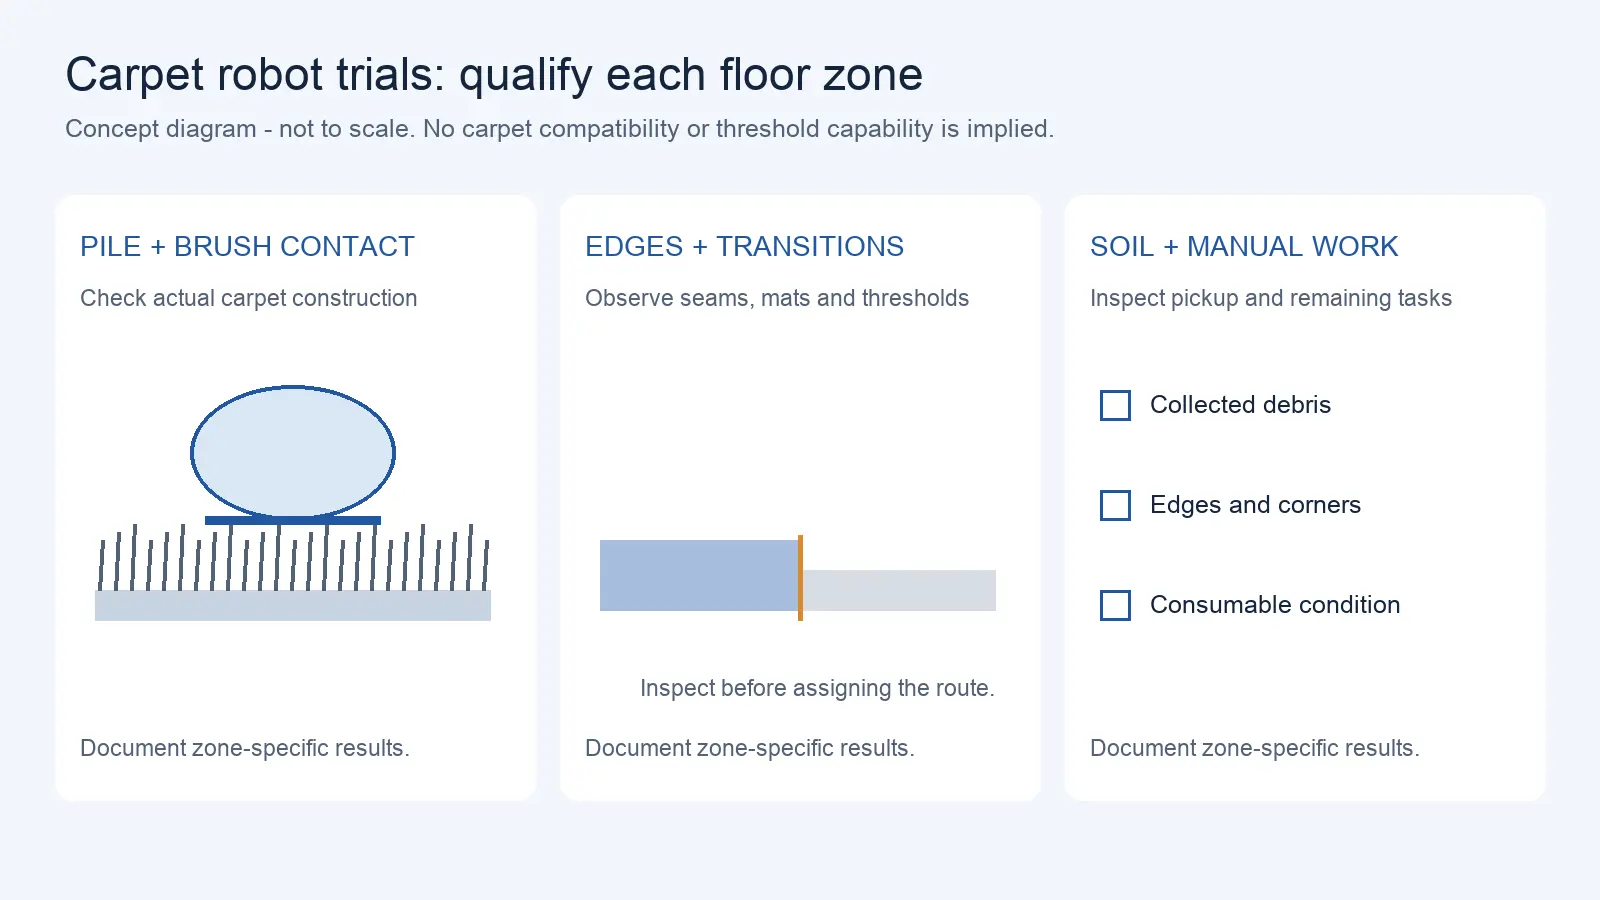
Commercial Carpet-Vacuuming Robots: Pile, Edge Transitions, and Maintenance Limits
Oct 12, 2026
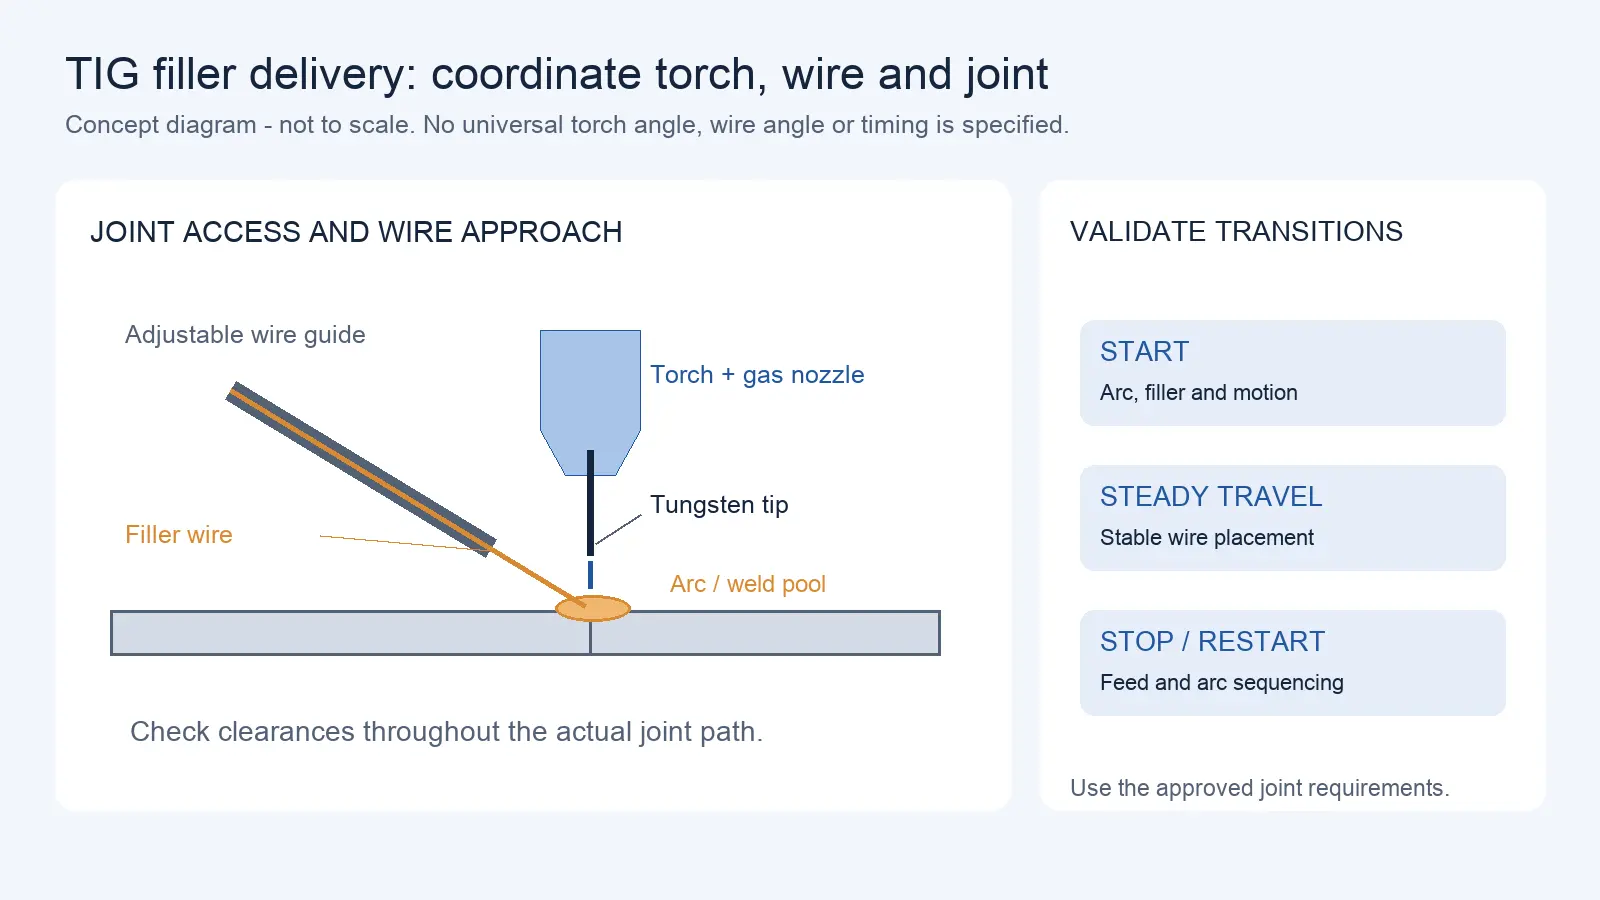
Robotic TIG Filler-Wire Delivery: Feed Angle, Arc Access, and Stop-Start Quality
Oct 12, 2026
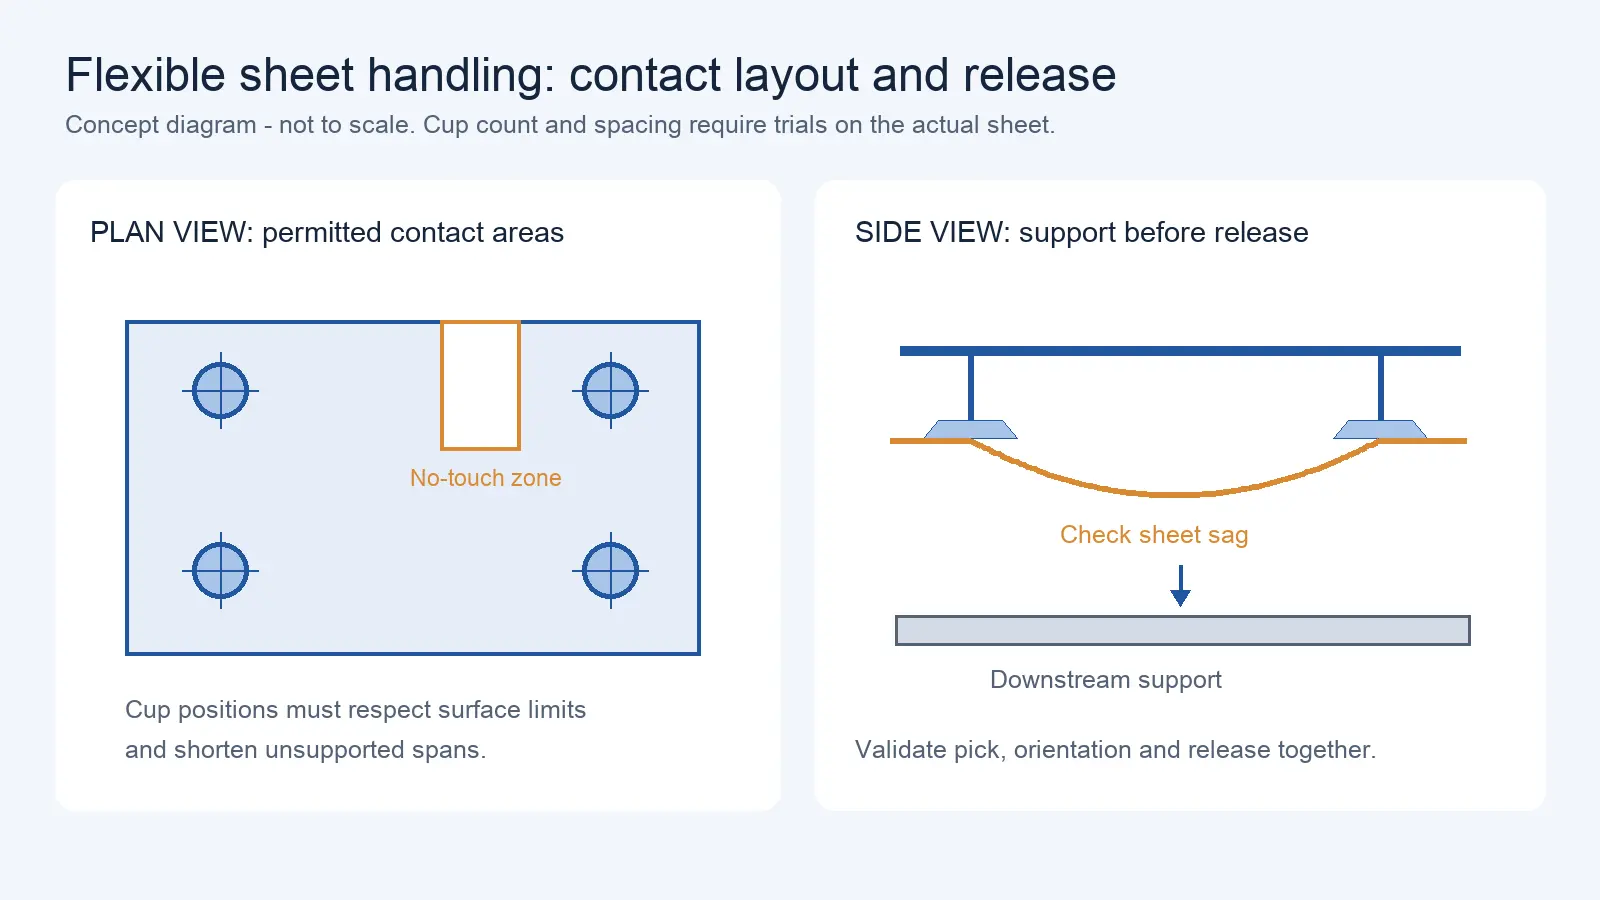
Suction Cup Layout for Flexible Sheets: Sag, Local Stress, and Controlled Release
Oct 12, 2026
“How many robots do we need?” is one of the first questions in any robot fleet project—and one of the most frequently answered incorrectly. The common approach of dividing the total area by a single robot’s rated coverage, or dividing total deliveries by a single robot’s rated capacity, produces a number that looks precise but ignores the realities of charging, traffic, peak demand, maintenance, and failure. This article explains why simple division does not work, how to convert business demand into robot task requirements, and how to build a fleet sizing estimate that accounts for the losses and redundancies of real-world operation.
Why “Area / Rated Productivity” Is Not a Fleet-Sizing Method
A cleaning robot is rated to cover a certain area per hour (check the manufacturer’s rated coverage for the specific model). The facility has 20,000 m². Dividing 20,000 by the rated coverage gives a certain number of hours of cleaning—or, with a defined operating window, a certain number of robots. This calculation appears logical but is unreliable for several reasons:
- Rated productivity assumes ideal conditions: flat floor, no obstacles, no traffic, continuous operation. Real facilities have furniture, racking, pedestrians, forklifts, narrow aisles, and surface transitions that reduce effective coverage.
- Charging time is not included: a robot that runs for 4 hours and charges for 1 hour has an 80% duty cycle, not 100%.
- Peak vs. average demand is ignored: if the cleaning window is 4 hours but 60% of the area must be cleaned in the first 2 hours (due to shift schedules or traffic restrictions), the fleet must be sized for peak, not average.
- Refill and discharge time is excluded: cleaning robots need water refills and wastewater discharge, which consumes time per cycle.
- Maintenance and failure are not considered: a fleet sized with zero redundancy means that one robot’s failure reduces coverage by the full share of that robot.
- Traffic congestion is not modeled: multiple robots in the same area create congestion at intersections, charging stations, and docking points.
The same logic applies to delivery robots (orders per hour / deliveries per robot) and intralogistics AMRs (moves per hour / moves per robot). The rated capacity is a theoretical maximum, not a planning number.
Convert Business Demand into Robot Tasks
The correct approach is to start with the business demand—the actual work that needs to be done—and convert it into robot task requirements. This means defining:
- What is the task? (clean a floor, deliver a tray, move a tote)
- How much of the task is there? (area, orders, moves—per hour, per shift, per day)
- What is the time window? (when must the task be completed?)
- What is the effective capacity per robot? (measured or estimated based on cycle components, not rated maximum)
- What redundancy is required? (what happens when one robot is down?)
The fleet sizing formula is:
Required robots = Business demand / Effective capacity per robot + Redundancy
Where:
- Business demand = peak demand (the highest-volume period that the fleet must serve)
- Effective capacity per robot = measured or estimated throughput per robot after accounting for charging, traffic, queueing, maintenance, and other cycle losses
- Redundancy = additional robots to maintain service level when one or more robots are unavailable
Important: Avoid double-counting losses. If you measure effective capacity per robot by timing actual cycles (including charging, queueing, and traffic delays), do not also apply a separate “loss factor” to the demand side. The losses are already captured in the effective capacity. Apply the loss either to the capacity side (measure real cycle time) or to the demand side (add a buffer), not both.
Cleaning: Area, Shift Window, Refill, Charging and Peak-Hour Losses
Illustrative scenario (all figures are hypothetical for calculation demonstration):
Step 1: Define the cleaning demand
| Parameter | Illustrative Value | Your Value |
| Total area to clean | 20,000 m² | |
| Cleaning frequency | Once per day | |
| Shift window | 6 hours (22:00-04:00) | |
| Peak requirement | 60% of area in first 3 hours | |
| Floor types | 70% hard floor, 30% carpet |
Step 2: Measure effective coverage per robot
Instead of applying generic loss percentages, measure or estimate the actual cycle components:
| Cycle Component | How to Measure | Illustrative Value |
| Navigation loss (obstacles, surface transitions) | Time study or pilot measurement | 15% reduction from rated |
| Refill/discharge time | Measure actual refill + discharge time per cycle | 15% reduction |
| Charging time | Measure charging duty cycle (charge time / (charge time + run time)) | 20% reduction |
| Maintenance/servicing | Track scheduled and unscheduled maintenance time | 5% reduction |
Note: these components may overlap. A robot that is charging is not also navigating or refilling. Use time study to avoid double-counting.
Effective coverage per robot = Rated coverage x (1 - combined loss) = 1,000 m²/hr x 0.55 = 550 m²/hr
This figure is specific to this illustrative scenario. The actual loss depends on the site, robot model, floor conditions, and operational patterns.
Step 3: Calculate peak demand
Peak demand = 60% x 20,000 m² = 12,000 m² in 3 hours = 4,000 m²/hr
Step 4: Calculate required robots (before redundancy)
Required robots = 4,000 / 550 = 7.3 -> 8 robots
Step 5: Add redundancy
Redundancy is determined by the required service level, failure modes, repair time, and peak headroom—not by a fixed ratio. If the cleaning must complete even with one robot unavailable, add 1 robot: 8 + 1 = 9 robots. If the cleaning window can be extended when a robot is down, redundancy may not be needed.
Step 6: Validate with a pilot
Deploy a subset of robots at the site and measure actual coverage, refill frequency, charging time, and obstacle interaction. Compare actual performance to the model and adjust the fleet size accordingly.
Delivery: Orders per Hour, Route Time, Elevator Wait and Handoff
Illustrative scenario (all figures are hypothetical for calculation demonstration):
Step 1: Define the delivery demand
| Parameter | Illustrative Value | Your Value |
| Orders per hour (peak) | 30 orders | |
| Average route time per delivery | 8 minutes (pickup to drop-off to return) | |
| Operating hours | 16 hours/day | |
| Floors served | 3 floors | |
| Elevators | 2 elevators shared with guests |
Step 2: Define the cycle boundary and measure effective deliveries per robot per hour
First, define the cycle boundary clearly. Does “route time” include elevator wait and handoff, or are these separate? To avoid double-counting, define the complete cycle from task assignment to task completion:
Complete cycle = travel time + elevator wait + handoff (loading + unloading)
| Cycle Component | Illustrative Value |
| Base travel time (pickup to drop-off to return) | 8 min |
| Elevator wait | 4 min average |
| Handoff (loading + unloading) | 2 min |
| Complete cycle time | 14 min |
Effective deliveries per robot per hour (before charging) = 60 min / 14 min = 4.3 deliveries/hour
Adjust for charging (measured duty cycle): 4.3 x (1 - 0.20) = 3.4 deliveries/hour
Do not add separate loss factors for traffic and maintenance if the cycle time was measured in real conditions—the traffic delay is already in the measured cycle time. If the cycle time is estimated (not measured), add a buffer—but only on one side of the equation.
Step 3: Calculate peak demand
Peak demand = 30 orders/hour
Step 4: Calculate required robots (before redundancy)
Required robots = 30 / 3.4 = 8.8 -> 9 robots
Step 5: Add redundancy
Determine redundancy based on required service level and failure modes. If the delivery service must maintain 30 orders/hour even with one robot unavailable, add 1 robot: 9 + 1 = 10 robots.
Step 6: Validate with a pilot
Deploy a subset of robots and measure actual route time, elevator wait time, handoff time, and charging frequency. Compare to the model and adjust.
Intralogistics: Moves per Hour, Travel Distance, Queueing and Charging
Illustrative scenario (all figures are hypothetical for calculation demonstration):
Step 1: Define the intralogistics demand
| Parameter | Illustrative Value | Your Value |
| Moves per hour (peak) | 60 moves | |
| Average travel distance per move | 120 meters (one way) | |
| Average robot speed | 1.2 m/s | |
| Pickup/drop-off time | 30 seconds each | |
| Operating hours | 24 hours |
Step 2: Calculate effective moves per robot per hour
Base travel time per move = (120 m x 2) / 1.2 m/s = 200 seconds = 3.3 minutes Add pickup/drop-off: 3.3 + 0.5 + 0.5 = 4.3 minutes per move
If this cycle time is measured in real conditions (including traffic and queueing), do not add separate loss factors. If it is theoretical (no traffic, no queueing), measure or estimate the actual cycle time through a pilot.
Illustrative: if measured cycle time including traffic and queueing is 6 minutes per move:
Effective moves per robot per hour (before charging) = 60 / 6 = 10 moves/hour
Adjust for charging (measured duty cycle): 10 x (1 - 0.20) = 8 moves/hour
Step 3: Calculate peak demand
Peak demand = 60 moves/hour
Step 4: Calculate required robots (before redundancy)
Required robots = 60 / 8 = 7.5 -> 8 robots
Step 5: Add redundancy
Determine redundancy based on required service level and failure modes. Add robots as needed to maintain service level during robot unavailability.
Step 6: Validate with a pilot
Deploy a subset of robots and measure actual travel time, queueing time, and charging frequency. Compare to the model and adjust.
Redundancy: What Happens When One Robot Is Down
Redundancy is a design requirement for any fleet that must meet a service level. The question is not “should we have redundancy?” but “how much redundancy do we need?”
Redundancy Factors
| Factor | Impact on Redundancy |
| Service level requirement | If full throughput must be maintained at all times, redundancy must cover the largest single failure scenario |
| Failure frequency and repair time | Robots with higher failure rates or longer repair times need more redundancy |
| Peak vs. average demand | If the fleet is sized for peak, average-period capacity may absorb one robot’s loss without additional redundancy |
| Maintenance window | If robots can be taken offline for maintenance during low-demand periods, less redundancy is needed |
The redundancy decision should be documented as part of the fleet sizing model, not left to intuition. “We added 1 robot for redundancy” is a decision that can be reviewed and adjusted based on actual failure data.
Peak Capacity vs Average Capacity
One of the most common fleet sizing errors is designing for average demand and then failing to meet peak demand. The fleet must be sized for the peak period—the hour, shift, or season when demand is highest.
Peak Demand Scenarios
| Application | Peak Period | Why It Matters |
| Cleaning | Shift change (high foot traffic before cleaning window) | Cleaning must be completed before operations resume |
| Delivery | Meal service hours | Delivery volume during meal service may be significantly higher than average—measure property-specific peaks |
| Intralogistics | Production line changeover | Moves spike during product changeover |
| Seasonal | Holiday season, inventory peak | Annual peak may be significantly higher than average—measure actual seasonal variation |
Designing for average means the fleet is oversized during low-demand periods (wasting capital) and undersized during peak periods (missing service levels). The solution is to size for peak and manage utilization during low-demand periods through:
- Scheduling maintenance and charging during low-demand periods
- Using robots for secondary tasks during low-demand periods
- Accepting lower utilization as the cost of meeting peak service levels
Fleet-Sizing Worksheet and Pilot Validation Plan
The following worksheet structure can be used for any robot application:
| Worksheet Section | Fields |
| 1. Business demand | Task type, total volume (area/orders/moves), frequency, time window, peak vs. average |
| 2. Robot parameters | Rated capacity (coverage/deliveries/moves per hour), speed, battery capacity, charging time, refill/discharge time |
| 3. Site parameters | Area/layout, route distances, obstacle density, elevator count, aisle widths, floor types |
| 4. Effective capacity per robot | Measured or estimated throughput after accounting for charging, traffic, queueing, maintenance (avoid double-counting) |
| 5. Required robots | Peak demand / effective capacity per robot (round up) |
| 6. Redundancy | Additional robots based on service level, failure modes, and repair time |
| 7. Total fleet size | Required + redundancy |
| 8. Pilot validation | Deploy subset, measure actual performance, compare to model, adjust |
Pilot Validation Plan
The fleet sizing model is a prediction. The pilot is the reality check. The pilot should:
- Deploy a subset of robots (not the full fleet)
- Measure actual performance: coverage/deliveries/moves per hour, charging frequency, obstacle interaction time, refill frequency, queueing time
- Compare actual performance to the model
- Identify the largest gap between model and reality
- Adjust the model based on actual data
- Recalculate the fleet size
- Proceed to full deployment with the adjusted number
The pilot also surfaces issues that the fleet sizing model cannot predict: operator adoption, exception frequency, site-specific obstacles, and integration issues. These factors may not change the robot count, but they may change the deployment plan, SOPs, and support requirements. For AMR warehouse system design (traffic, charger placement, expansion architecture), see our AMR Fleet Design guide. For day-to-day fleet management capabilities, see our Robot Fleet Management guide.
Request a Quote or Technical Evaluation
Tell us what you need the robot to do. Even if some technical details are not yet confirmed, our team can help evaluate suitable options.
Please share, if available: application, key requirements, site and integration conditions, quantity, destination, and target timeline.
Send Your RequirementsShare on Social:


Contact Us
In This Article
Delivery Robot Accessibility: Tray Reach, Controls, and Assisted Handoffs
Oct 12, 2026
Commercial Carpet-Vacuuming Robots: Pile, Edge Transitions, and Maintenance Limits
Oct 12, 2026
Robotic TIG Filler-Wire Delivery: Feed Angle, Arc Access, and Stop-Start Quality
Oct 12, 2026
Suction Cup Layout for Flexible Sheets: Sag, Local Stress, and Controlled Release
Oct 12, 2026